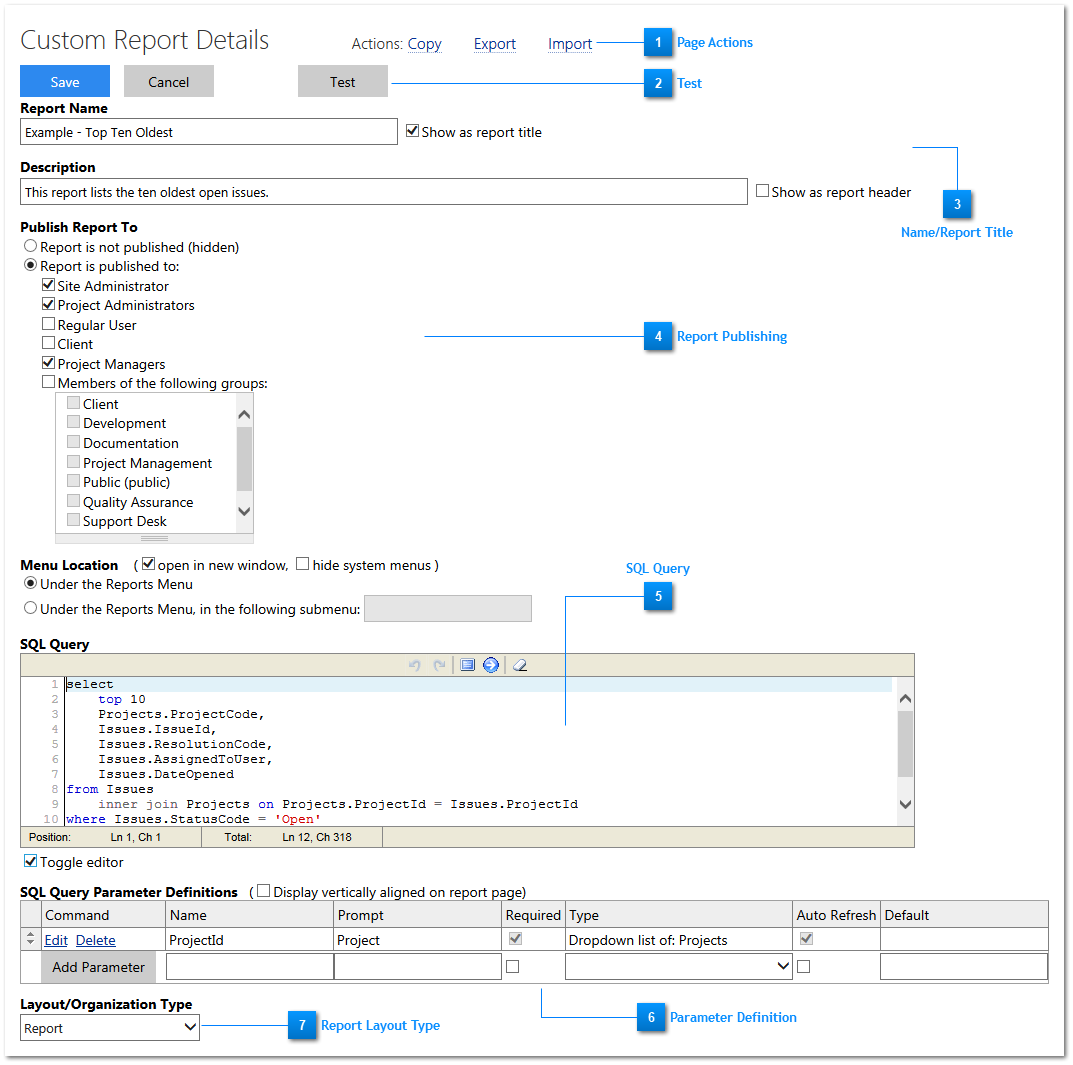
Clicking the Copy link at the top of the page will copy the existing report to a new report.
Reports can be Exported and Imported between RMTrack sites. This is useful when using a test or development site of RMTrack and for receiving reports created with the assistance of RMTrack Support.
Test
There are Test buttons located at the top and the bottom of the page. The test button will launch a new browser tab and run the report. This allows for quick testing of reports without actually saving the report or publishing the report.
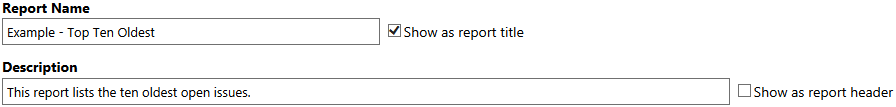
Name/Report Title
The Report Name is what will appear in RMTrack menu for any users that have access to the report. This name should be meaningful enough to identify the report without being excessively long.
The Show as report title checkbox controls whether the Report Name will be shown as a title on the page when the report is run.
The Description will appear beside the report name in the list of reports and can also be displayed as part of the report by checking the Show as report header box.
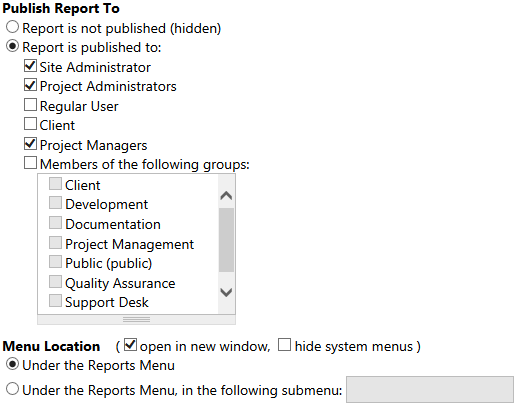
Report Publishing
You can choose who has access to the report by publishing only to specific groups and/or security types. For more information please see Report Publishing.
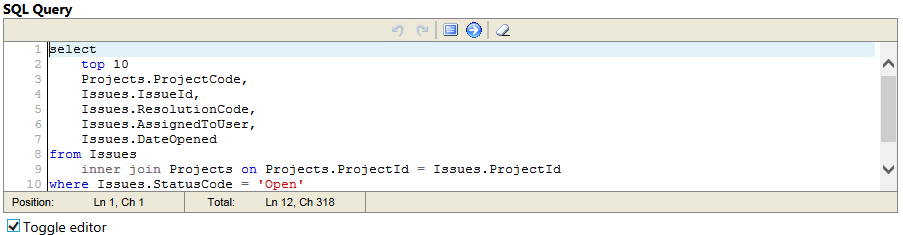
SQL Query
The actual SQL query to generate the data for the report is entered into the SQL Query area. For more information please see SQL Query.
There is a checkbox below the Query area that allows you toggle between a simple text entry and a more robust editor. This editor has options for full screen mode, undo/redo, and go to line #. It is useful when writing more complex queries.
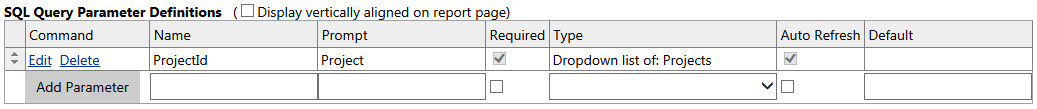
Parameter Definition
To make reports more useful to the end user, you can provide parameters like "Which Project?" or "What Date Range?". For more information please see Report Parameters.
Report Layout Type
There are eleven report layout types available. Each type has different settings available:
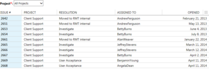
A column and row oriented report where individual fields are displayed in columns. Can include secondary rows (maximum of ten). Columns can be field data, subreports or hyperlinks.
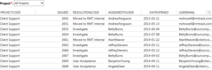
Same as above except the column names are generated based on the SQL result set field names. Useful for simple reports or for reports where the columns of the result set are not pre-determined (eg. a result set generated by a crosstab).