RMTrack custom reporting allows for two types of line graphs:
1. Simple single series line graph
A line graph showing a single line
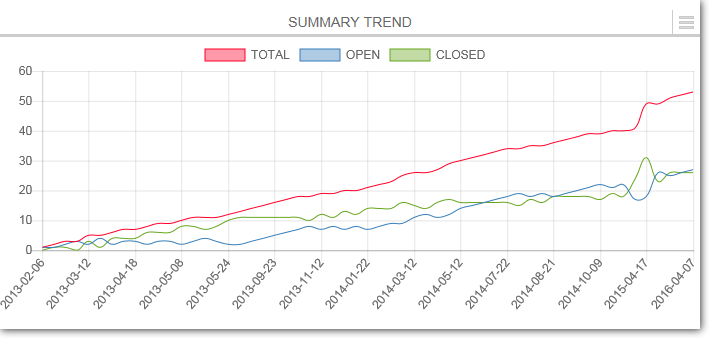
2. Multi-series line graph
A multi-line graph showing up 6 lines
The most common use of line graphs is to show data over time.
The X-Axis values must be automatically convertible to a double precision floating point value. For this example the CreateDate column is a DATETIME type, which can be automatically converted to a double precision floating point value. Virtually any numeric or date value can be automatically converted. Character values, or strings, cannot be automatically converted and a query would need to do an explicit conversion using the SQL functions CAST or CONVERT. The labels for the X-axis are automatically determined.
NOTE: The example report shown on this page is part of the Example Reports package download. This report is called "Example - Summary Trends".
This report is very similar to the stock report called 'Summary Trends' and is also a good example of a complex report using SQL temporary tables.