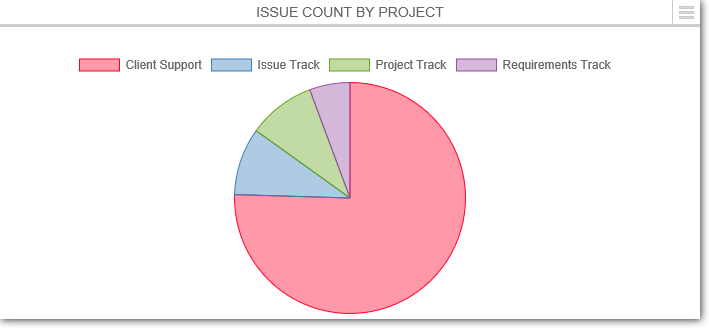
RMTrack custom reporting supports a simple pie chart:
Pie charts are generally used to display "counts" by "category". In the example above, number of issues per project.
NOTE: The example report shown on this page is part of the Example Reports package download. This report is called "Example - Pie Chart".
|